ODIN AIVERIFIED ACROSS MULTIPLE PLAYS·END-TO-END COMPLETION OPTIMIZATION
A step-change in data-driven decision-making for oil & gas field development.
Odin AI uses deep neural networks to accurately predict the relationship between well design / execution parameters and subsequent well performance — with verified results across multiple plays. The platform measures productive fracture area as it is placed, predicts productivity by stage from pumping data, and guides operators in real time.
01 / MEASURE
Productive fracture area as it is placed
02 / PREDICT
Productivity by stage from pumping data
03 / OPTIMIZE
Capital efficiency for new well pads — unintrusive, real-time AI guidance during pumping
HOW IT WORKS
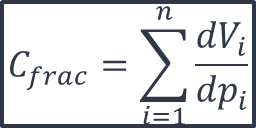
Three stages, one model: CFrac — fracture compliance per stage.
01 · TRAINING
Build the CFrac population
Odin AI defines hundreds of thousands of discrete fracture-compliance events by stage over many wells within a defined area.
CFrac · sum of stage-level dV / dp · the discrete fracture-compliance signal
02 · CALIBRATION
Correlate to well performance
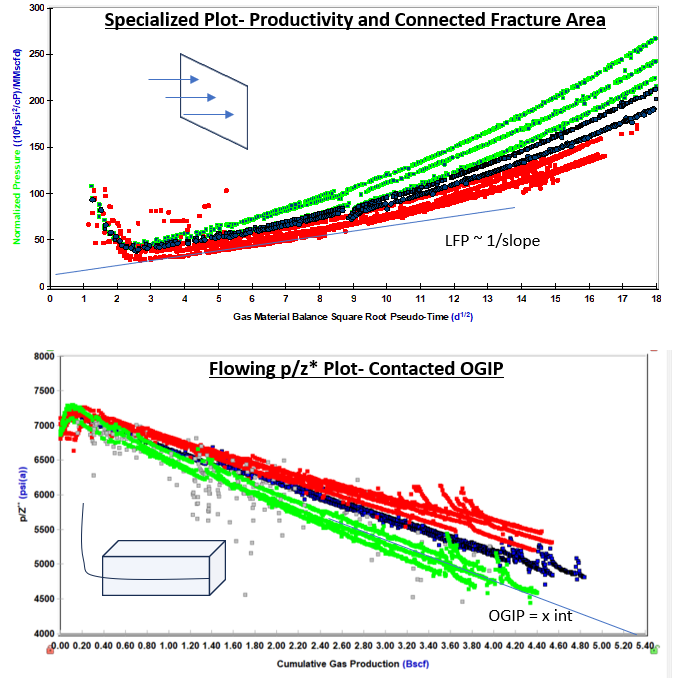
CFrac is correlated to well performance parameters using Rate Transient Analysis — the mechanical response per stage is anchored to the production it eventually delivers.
Productivity (LFP) & contacted OGIP
03 · OPTIMIZATION
Apply in real time
The calibrated CFrac model is applied in real-time on the pad — unintrusive AI guidance during pumping.
CFrac predicted well performance better than any other single variable.
n = 7 wells
6-month cumulative gas
Public · live pilot May 2026
Halo Exploration (HE) — the Montney operator on this pilot — needed to understand why its wells were underperforming. Conventional completion levers — total fluid, lateral length, proppant — explained ≤12% of the production spread. Odin AI provided actionable insights with CFrac analysis: normalizing each completion metric by CFrac (measuring fracture productivity per unit pumped) turned weak drivers into statistically significant predictors. Landing depth and pump rate emerged as the major influencers.
FINDING 01 · DIAGNOSIS
Bigger fracs did not produce better wells.
Total proppant correlates with production at R² = 0.000. Lateral length at 0.062. Fluid intensity at 0.103 (wrong sign). Traditional completion variables do not explain the spread.
FINDING 02 · NORMALIZATION
Normalize by CFrac and weak variables become strong predictors.
Raw fluid intensity explains 10% of variance and trends negative. CFrac per unit fluid intensity explains 77%. The pumped fluid only matters in proportion to the fracture response it produced.
FINDING 03 · ACTIONABLE LEVERS
Landing depth & pump rate schedule identified as major production influencers.
Through CFrac analysis, the levers that actually move production at HE are landing depth and pump rate — guidance HE could apply to the next pad rather than waiting on conventional completion-design heuristics.
HEADLINE
CFrac alone explains 93.8% of production variance — every traditional driver explains ≤12%.
TOTAL FLUID · RAW vs CFRAC PER 1,000 BBL
HE · 7 wells · production vs Total Fluid (bbl) and vs CFrac / Total Fluid
Total Fluid (bbl) alone vs Production
CFrac per 1,000 bbl vs Production
LATERAL LENGTH · RAW vs CFRAC PER 1,000 FT
HE · 7 wells · production vs Lateral Length and CFrac vs CFrac / 1,000 ft
Lateral Length vs Production
CFrac per 1,000 ft vs Production
Reading the plots · Left: raw metric vs production — weak / wrong-sign relationship, p > 0.05 (not significant). Right: same metric normalized by CFrac — strong positive correlation, p < 0.05 (significant). The mechanical response per barrel pumped and per foot of lateral is what production tracks, not the absolute job size.
CASE STUDY · HE · MONTNEY
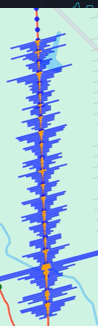
Landing depth, measured: CFrac rises as the lateral steers into the S2.
Well 103/10-20
Stage-level CFrac vs S2
Public · HE
HE, the Montney operator, saw its southwest wells underperform, and the postmortem pointed at landing depth. Using CFrac, Odin AI measured the effect stage by stage in well 103/10-20 — all 95 stages: as the lateral porpoises toward the S2, fracture compliance rises; as it drifts away, it falls. The relationship is overwhelmingly significant — landing depth alone explains R² = 0.46 of stage-to-stage CFrac at p ≈ 6.6 × 10⁻¹⁴. And because CFrac in turn predicts 6-month production (R² = 0.94), it doubles as a measurement instrument: we decompose it stage by stage into the levers that built it.
FINDING 01 · SIGNAL
Toward the S2, CFrac rises; away from it, CFrac falls.
Across all 95 stages of 103/10-20, stage CFrac tracks how close each stage lands to the S2 bench — R² = 0.46 at p ≈ 6.6e-14. It's the clearest landing-depth signal in HE's dataset.
FINDING 02 · WHAT INFORMS CFRAC
Once CFrac predicts production, we decompose it into the stage-level levers that built it.
Landing depth, rate execution, stage chemistry and total volume each pull on CFrac. Quantifying that split stage by stage — and showing operators which lever was binding on which well — is the core of the Phase B report we deliver. Draft · pending data QC.
FINDING 03 · RATE EXECUTION
In 103/10-20, how cleanly a stage held design rate explains ~17% of its CFrac.
A statistically strong effect (R² = 0.17, p < 0.001) measured at constant landing depth — stages that reached and held design rate scored higher CFrac. Execution, not just placement, moves effectiveness. Draft · pending data QC.
FINDING 04 · ACTIONABLE TARGET
Average CFrac ≈ 3.8 per stage repeats 103/10-20 — push above 4.0 and production steps up.
Because CFrac per stage maps to 6-month production, HE can set a stage-level target rather than guess — land in the S2 and shape the pump schedule by distance to it.
HEADLINE
Held at CFrac > 4.0 across ~100 stages, HE's wells model to over 400 bpd for the first 6 months.
103/10-20 · CFRAC vs DISTANCE TO S2
HE · 95 stages · per-stage CFrac vs distance to the Montney S2 (m)
Distance to S2 (m) · closer to the S2 → higher CFrac · 95 stages
CFRAC PER STAGE → 6-MONTH PRODUCTION
HE · 7 wells · 6-month cum vs CFrac per stage (cumulative ÷ 100 stages)
CFrac per stage vs Production · target ≈ 3.8, step-change > 4.0
Reading the plots · Top: each point is one of 103/10-20's 95 stages — the closer it lands to the S2, the higher its CFrac (R² = 0.46, p ≈ 6.6e-14). Bottom: roll those stages up across the field and 6-month production tracks CFrac per stage at R² = 0.938 — the basis for a per-stage CFrac target rather than a job-size guess.
CASE STUDY · HE · MONTNEY
Seven wells. Seven bottlenecks. One ranking that finds them.
7 wells · 590 stages
Per-well driver ranking
Phase B deliverable
Across HE's seven Montney wells, no two underperformed for the same reason — landing depth bound one well, rate execution another, placement a third. Conventional completion analysis can't separate those levers, because they move together. CFrac can: because it predicts 6-month production at R² = 0.94, we treat it as a measurement instrument and rank what built it — stage by stage, for every well.
THE PROBLEM
Seven wells, seven different bottlenecks.
Total fluid, lateral length and proppant explained ≤12% of the production spread — and the levers that actually matter (landing depth, rate execution, stage size) are tangled together. You can't optimize what you can't separate.
THE INSTRUMENT
CFrac pulls the levers apart — and ranks them.
Because CFrac tracks production tightly, we decompose each well's stage-level CFrac and rank the contributors two ways: what each explains on its own, and its share of a joint model.
THE TWIST
On 103/10-20, rate-hold quality explains ~17% of CFrac (p < 0.001) — and it's only the third-biggest lever.
The story was never one metric. It's the ranking — and the ranking is different on every well, which is exactly why a single number that absorbs all of them is what you need.
WHAT WE FOUND
The second-largest driver on this well is bigger than rate-hold — and it's redacted below.
CONTRIBUTORS TO STAGE CFRAC · 103/10-20
Within-well · ranked by variance explained (R²)
1
Landing depth · distance to S2
45%
2
████████████████
▒▒%
3
Rate-hold quality · held design rate
17%
4
███████████
▒%
5
█████████████
▒%
2 of 5 drivers shown · ranking is well-specific
The part we don't publish
So what is the #2 driver — the one bigger than rate-hold? And what are the metrics CFrac is built from? That's the Phase B conversation.
CASE STUDY · SCREEN-OUT MODEL · LIVE DATA
Predicting screen-outs on live data — before they bridge off.
Live pumping data
Real-time inference
Restricted · prescreened clients
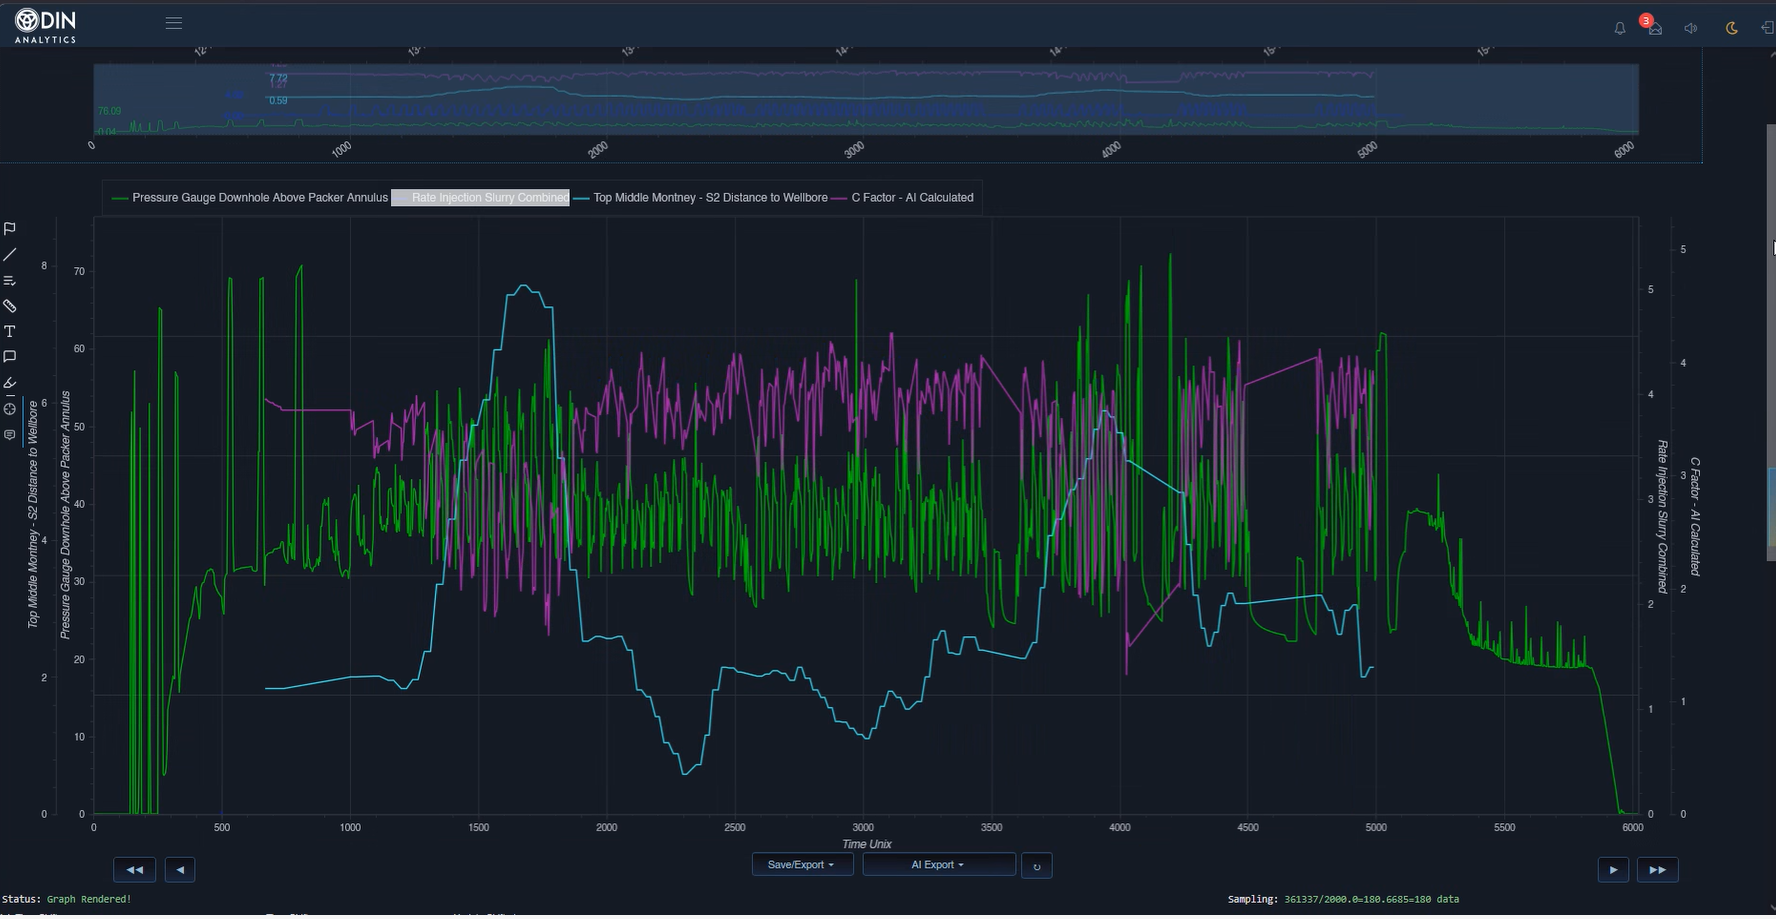
Odin AI's screen-out model runs against the live treating-pressure and rate stream and flags a developing screen-out while there is still time to react — adjusting chemicals, proppant schedule, or rate. The model can often detect a screen-out during the pad, giving the blender crew time to modify the pump schedule before sand begins. The footage below is a real field capture of the model calling a screen-out on live data. This footage is available to prescreened clients only.
Restricted · Clearance Required
Screen-Out Model — Live Field Capture
Real-time inference on live pumping data. Available to prescreened clients only — each request is verified before the stream is unlocked.
THE TEAM
Reservoir engineering, hydraulic fracturing, AI for STEM.
The Odin AI team has deep expertise across reservoir engineering, hydraulic fracturing and artificial intelligence for STEM applications — the right combination for end-to-end data-driven optimization in subsurface oil & gas.
David Cook
Founder & CEO · Odin AI
David Anderson
Principal Reservoir Engineer
John Thompson
Business Development
Clearance Verification
Request access to the screen-out footage
This is available to prescreened clients only. If you are a prospective customer, please fill out our contact form here.
If you've been cleared, enter your work details below to unlock the stream.
Direct line to the team
See the full CFrac driver ranking
Tell us a little about your play and we'll walk you through the complete per-well ranking — including the metrics behind CFrac — from HE's Phase B report.